
Lee Hower
Blue Apron filed their S-1 yesterday late in the day. The meal kit delivery startup has been one of the fastest growing consumer businesses in the US, and the company itself is becoming one of the pillars of the New York tech ecosystem (HQ in Manhattan + large fulfillment center in NJ right outside the city).
That Blue Apron is growing rapidly is obvious. The company grew revenue >300% in 2015 and >100% in 2016. Growth typically decelerates the larger and more mature a business gets, and Blue Apron is no different. In Q1 2017 they grew top line at a rate of 42% over Q1 2016, though it’s worth noting that they did $245M in revenue in Q1 2017 so they’re still growing at a good clip now that they’ve hit a $1 billion run rate.
The more important questions of course are how “good” of a business is this:
- When looking at underlying unit economics, how profitable is Blue Apron? (TLDR: fairly profitable)
- How does the customer acquisition cost (CAC) compare to the lifetime value (LTV) of a given consumer? (TLDR: pretty solid based on data in S-1)
- How efficient is marketing spend today and into the future? (TLDR: hard to tell, some stuff very clearly working well other stuff unclear)
- How should we assess the long-run sustainability, expandability, and defensibility of Blue Apron’s business? (TLDR: harder to tell, merits longer discussion beyond this post)
To Blue Apron’s credit, they provide a pretty substantial amount of data to would be IPO investors in the S-1 to make these assessments. You have to do some financial forensics to find the good stuff though, and some key info like churn data is not supplied in the S-1. My Google sheet with the data from the S-1 and my own calculated metrics is embedded below. I’m not an investor in or otherwise affiliated with the company, just a curious party looking at public data here.
Blue Apron S1 Financials
Let’s look at underlying unit economics first.
→ Gross margin is currently at 31%.
People sometimes use words like gross profit or contribution margin or net revenue interchangeably when they mean different things (especially in GAAP accounting), so it’s useful to understand what this actually is. Blue Apron’s “net revenue” is basically the gross revenue (all the money they get from consumers) minus returns for meals that get damaged or that customers don’t want and minus any promotional discounts. Their cost of goods (COGS) includes the actual food ingredients, packaging, fulfillment labor, and shipping.
Blue Apron’s COGS excludes rent expenses for fulfillment centers and payment processing fees (these are both baked into SG&A). This is standard accounting practice so nothing Blue Apron has done unusually here, but these two key costs would need to be known to calculate a true fully-loaded contribution margin. Since we don’t have the data to derive fully-loaded contribution margin, I will use gross margin for the further analysis and commentary below.
→ Blue Apron has done a good job becoming more profitable as it scaled
Most commerce businesses increase gross profit as they get bigger, since you have more buying power with suppliers and shipping companies and hopefully your internal operations get more efficient over time. Blue Apron had a 7% gross margin in 2014 which increased to 23% in 2015 and then grew to 33% in 2016. As of Q1 2017 it was just over 31% so appears to have stabilized.
If you dig deep in on p. 73–76 of the S-1, you can see where the improvements in profitability came from. The short version is that the first big margin expansion from 2014 to 2015 was primarily driven by lower shipping costs. The next big margin expansion from 2015 to 2016 was primarily driven by Blue Apron’s internal operational efficiency, as they got better at producing meal kits and getting them out the warehouse door.
Conclusion – Blue Apron is pretty profitable. We’re pretty familiar with commerce businesses at NextView, both public companies and rapidly growing startups in our own portfolio like Dia, ThredUp, and Grove Collaborative. Gross margins >30% are good, though Blue Apron’s fully-loaded contribution margin is undoubtedly somewhere in the 20%’s.
For reference Amazon’s overall gross margin is currently 37% but that includes AWS and Amazon Prime which have much higher margins (Amazon breaks out revenue and operating income by segment, but not gross margin). So it’s reasonable to say that Blue Apron’s gross margin is probably at least as good as Amazon’s core e-commerce biz.
Even though Blue Apron’s gross margin doesn’t appear to be expanding further at this point, I’m also pretty impressed by the operational efficiency they’ve driven in the last couple years. The improvements are very substantial especially when you consider Blue Apron’s business is pretty unique… it’s not just a traditional pick/pack/ship e-commerce company. They have to source raw food products at scale, “manufacture” meal kits from this food, and have a more complicated than average delivery chain (due to refrigeration needs).
So what do CAC & LTV look like?
The best way to think about Blue Apron is as a “conveyor belt” business. Some consumers try the service and churn of course, but those that stick around end up reordering a substantial amount akin to Blue Apron having a conveyor belt to sell product into people’s kitchens.
How do we know this?
→ 92% of Blue Apron’s net revenue in 2016 was from repeat customers and this has remained consistent in early 2017
→ Average order value (AOV) has remained consistent at just under $60 ($57 in Q1 2017)
→ Average of 4.1 orders / active customer / quarter
While Blue Apron doesn’t have highly detailed cohort data or specifics on churn in the S-1, they do helpfully provide some aggregated cohort data on net revenue (there’s notes which accompany this on pg 63–64 of the S-1).
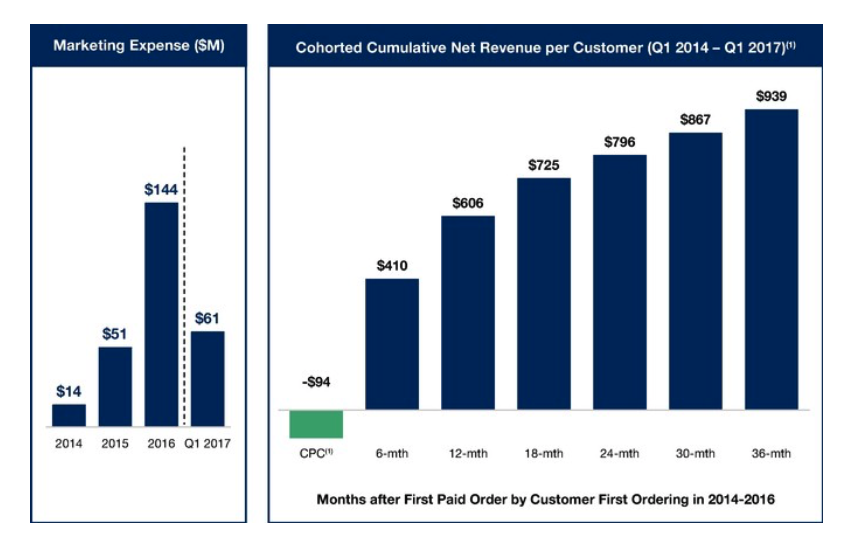
What this basically tells us is that for customers that have been in the system for at least 6mo, the average cumulative net revenue is $410 and so on. The cost of acquiring a customer is $94. Both of these figures includes the CAC and net revenue from customers that churn.
Per the discussion above, in past years Blue Apron was less profitable on a unit basis than it is today. So the gross profit on a customer acquired in 2014 was low in 2014, though today it is now ~31% assuming that customer has stuck around and kept ordering. So there’s a little mismatch of timing here, but the simplest way to think about the business is to use the trailing data for cumulative revenue per customer and the present data for gross margin.
The punchline is a 3-year LTV/CAC of 3.1x. Basically present gross margin of 31% and cumulative 3-year revenue of $939 and CAC of $94. You can look at my underlying math in the Google spreadsheet embedded above (LTV/CAC tab).
They key thing we don’t really know is are customer cohorts getting better, worse, or staying the same today. The aggregated cohort data is very useful but doesn’t give us a detailed picture of how customers acquired recently have faired relative to ones acquired awhile back. Furthermore while the cohorted data here includes customers that churned, in the financial sections of S-1 the “Customers” that’s reported is really active customers (e.g. how many ordered in that year/quarter).
The only hint we have about trends in customer quality is in p. 63 of the S-1… the 6mo cumulative revenue per customer was $402 for customers acquired in 2014, $451 for 2015 cohort, and $387 for 2016. We don’t know whether longer term (12mo, 18mo, etc) performance is better or worse or if the degradation is a result of more first time purchasers churning or fewer repeat orders by those who stick around.
So we can infer that customer quality is getting a little worse. But it’s not terrible… if you assume that 2016 cohort’s cumulative revenue is a little below the long run average based on data we have and you use the long-run average CAC, you still end up with an implied LTV/CAC of ~2.9x.
So how efficient is Blue Apron’s marketing spend?
There’s a decent amount of data about marketing spend in the S-1 you can read yourself or others have summarized.
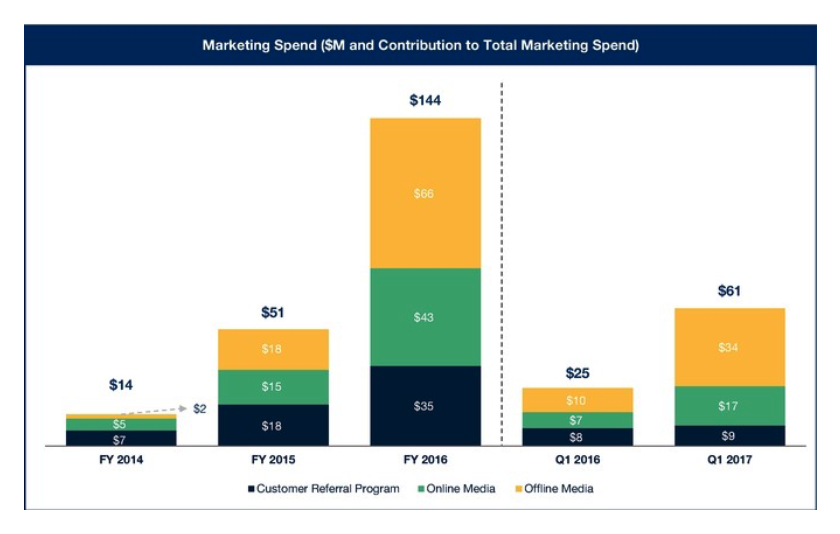
The bottom line is Blue Apron has been ramping spending to acquire customers and offline media like TV, radio, direct mail, out of home, etc is now the biggest part of total spend (56%).
Over the long run (2014–2016) Blue Apron has spent $94 on average to acquire a customer. But this masks undoubted disparities in CAC between different channels and also whether recent acquisition is getting more or less costly.
Some have suggested efficiency overall appears to be getting worse. For example this Recode piece incorrectly infers Blue Apron has recently been spending >$400 to acquire each new customer. The error is that “Customers” as reported in the S-1 is basically active customers (e.g. how many people ordered in a particular quarter / year), not cumulative customers added.
What’s perhaps most telling is that Blue Apron’s best performing channel is their customer referral program, whereby existing customers can refer friends and both parties get some free meals. In Q4 2016 39% of new customers came thru this channel. It dropped a little in Q1 as the company ramped other channels but still represented 34% of new customers. Put another way, over 1/3rd of new customers are coming from a pretty cheap, performance based channel that is <15% of current marketing spend.
Here is where we veer from the realm of pure analysis to informed speculation, given we can only work with the data publicly available. Blue Apron’s customer referral program is clearly working very well. It’s scalable but not infinitely so, given the bounds of the present active customer base.
By definition the traditional online (Facebook, Google, etc) and the offline spend is less efficient than the referral program, but that doesn’t necessarily mean it’s unprofitable. Without more granular data, we can’t calculate CAC per channel or see how present CAC compares to the past. But elsewhere in the S-1 Blue Apron provides brand awareness lift and other metrics related to their offline spend. They also assert that offline media spend not only drives brand awareness and new customers, but they also believe it drives retention and repeat order by existing customers. If true then it’s harder to disaggregate the value of the spend per channel, e.g. if TV helps drive repeat usage by customers acquired from say the referral program than it can have a strong ROI.
My rough analogy of Blue Apron’s marketing is it’s like oil/gas exploration. You spend a bunch of dough up front to drill exploratory wells. A bunch of them don’t pan out (e.g. churned customers in Blue Apron’s case). But the ones that do are gushers that delivers consistent and persistent profits.
How should we assess Blue Apron’s long run sustainability and defensibility?
Again this is worthy of a separate and longer discussion. The company has thoughtfully provided some context and data about market sizes and penetration. The big question here is “compared to what?” Overall Blue Apron is a pretty remarkable and impressive business IMO. It’s not easy to say whether we should compare it to traditional e-commerce companies or grocery or restaurants or what though.